


Contents
Scroll to:
https://doi.org/10.23947/2414-1143-2025-11-3-14-23
Scroll to:
Introduction. The relevance of the study is mainly due to the fact that the analysis of the dynamics of the population aging process, as well as its territorial characteristics, plays an important role in the process of determining various complex plans for the development of territories, from individual settlements to macroregions and entire states. The purpose of the study is to determine the spatial features of dynamics of population ageing of the Crimean Peninsula in the last intercensus period (2014‒2021), which, in turn, makes it possible to assess further prospects for its transformation at the level of leading cities and administrative regions.
Materials and Methods. Using the complex method of Z. Dlugosh, the population aging dynamics index of all municipalities of the peninsula was calculated, they were classified by the type of age structure, as well as by the level of intensity and direction of its transformation. Statistical analysis methods such as summary, grouping, as well as correlation and regression analysis of the obtained statistical data also acted as a research tool. The foundation of the information base of the study was the materials of the All-Russian Population Census 2014 and 2020 (2021) in the Republic of Crimea.
Results. It has been established that all municipalities of the Republic of Crimea are characterized by an old age structure of the population, which varies in the range from moderately old to very old. In the dynamic aspect on the peninsula for the analyzed period, municipalities can be distinguished with a trend of slow and moderate rejuvenation (respectively 28 and 8% of the total number of municipalities), slow and moderate aging (56 and 4%, respectively). Their placement did not record both distinct spatial patterns (territorial zoning) and noticeable differences between urban districts and rural areas (levels and forms of settlement).
Discussion and Conclusion. In the nearest future, there is no need to talk about a significant transformation of the types of age structure in the municipalities of Crimea, since in more than 90% of municipalities with a very old age structure of the population, there is currently a tendency towards either slow or moderate aging, and a number of municipalities with moderately old and old age structure also maintain the trend towards population aging.
Uznarodov D.I. Territorial and Settlement Characteristics of the Dynamics of Population Ageing in the Republic of Crimea (2014‒2021). Science Almanac of Black Sea Region Countries. 2025;11(3):14-23. https://doi.org/10.23947/2414-1143-2025-11-3-14-23
Introduction. The process of gradual aging of the population, to one degree or another characteristic of all modern modernized societies, is comprehensively related to the functioning of the main segments of social infrastructure, largely determines the vectors for the development of local health care, education, and pension systems. In this regard, the analysis of the dynamics of the population aging process, its territorial features, is of direct practical importance in the development of comprehensive plans for the development of territories of any taxonomic level from individual settlements to macroregions and entire states.
The objectives of our study include an analysis of the territorial and settlement features of the dynamics of population ageing in the Republic of Crimea by classifying the municipalities of the peninsula by the types of the population age structure, as well as by the degree of intensity and transformation vectors of its age structure; identification of the main territorial and settlement features of this process in the Russian period of the republic’s development.
The chronological framework of the study is due not only to the fact that the entry of Crimea into Russia in the spring of 2014 opened a new stage in its demographic, ethnocultural, socio-economic development [1, p. 126], but also significant discrepancies in the series of Ukrainian and Russian periods.
The results of the study make it possible to record the spatial features of the dynamics of population aging process of the Crimean Peninsula in the last inter-census period (2014‒2021), which also makes it possible to assess further prospects for its transformation at the level of leading cities and administrative regions.
Research review and information base. Some aspects of the problem of interest to us were touched upon in a number of studies on geodemographic processes in the territory of modern Crimea [1, 2–7]. Nevertheless, the peculiarities of the dynamics of the population aging process of the peninsula in the Russian period need a more detailed study, including spatial analysis, in the context of municipalities. There are 25 of them in the republic (11 urban districts and 14 rural areas).
The study was based on data from 2014 and 2020 (2021) censuses [8, 9] on the basis of which calculations were made and the classification of municipalities by type of age structure and characteristics of its subtype was carried out, which made it possible to identify a number of features of the dynamics of the population aging process in the Republic of Crimea.
Materials and Methods. We used the Z. Dlugosh method as a working one, which makes it possible to identify the directionality and rate of changes in the age structure through the calculation of the aging dynamics index, which reflects the differences between the proportions of old and young age groups during the study period [10].
To typologize the obtained quantitative values of the aging index, an equal-interval open scale was used, from the work of O.O. Sekitsky-Pavlenko “Typology of transformation of the population age structure of Russian regions”, which was also based on the methodology developed by Z. Dlugosh [10, 11].
“The application of this method involved several stages. At the first stage, the population aging index of all municipalities of the Republic of Crimea was calculated (according to the data of 2021), which was calculated as the ratio of the number of people over 60 to the number of children and adolescents (0–14 years old):
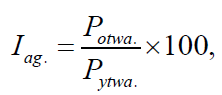
where Iag. — aging index; Potwa. — population over working age; Pytwa. — population under working age. The lower the aging index, the younger the population structure” [11, p. 818].
At the second stage, the aging dynamics index was calculated according to the method of Z. Dlugosh [10], which made it possible to determine the vector and intensity of the age structure transformation process. The formula for calculating the aging dynamics index was as follows:
where WSD — aging dynamics index; Pytwa.(t) — proportion of the population under working age at the beginning of the study period; Pytwa.(t+n) — proportion of the population under working age at the end of the study period; Potwa.(t+n) — proportion of the population over working age at the end of the study period; Potwa.(t) — proportion of the population over working age at the beginning of the study period. High index values indicate the intensive process of population aging in a particular municipality, and negative values indicate the process of rejuvenation of the population of this administrative-territorial community.
In the method used, eight types of intensity of demographic aging/rejuvenation are distinguished: 1) rapid aging; 2) active; 3) moderate; 4) slow aging; 5) slow rejuvenation; 6) moderate; 7) active; 8) rapid rejuvenation [10, 12].
Results. Among the municipalities of the Republic of Crimea, the study revealed only four options for the intensity of the transformation process of the age structure: with trends of slow or moderate rejuvenation; slow or moderate aging (Table 1). As a result, each type of age structure corresponds to 4 subtypes characterizing the direction of the ongoing transformations.
The results of calculating the aging index and the aging dynamics index for each of the municipalities of Crimea are presented in Fig. 1. Table 1. The classification of municipalities by vector and degree of intensity of change in the age structure of the population is given.
The calculations made make it possible to attribute the municipalities of the peninsula to the following types of the population age structure: 1) moderately old — 6 (24%); 2) old — 8 (32%); 3) very old — 11 (44%). Administrative entities with the youngest types of age structure of the population on the peninsula are currently absent.
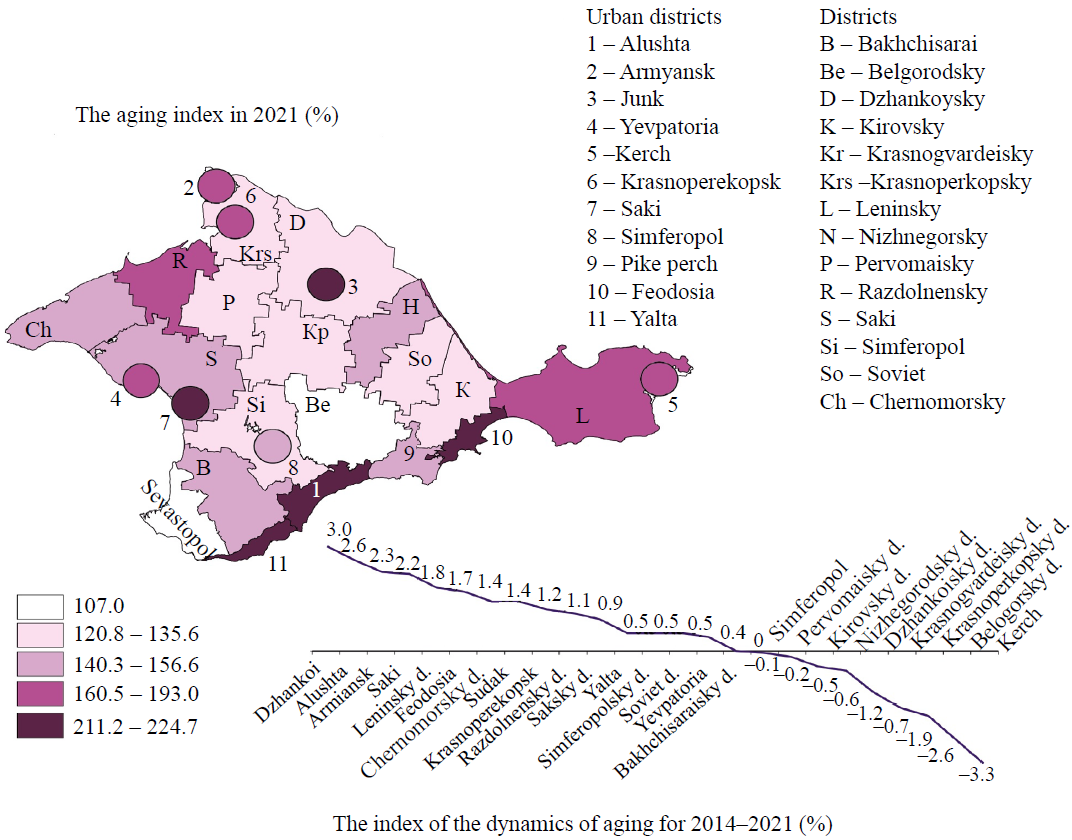
Fig. 1. Indices of aging and dynamics of aging of the population of Crimea in the territorial context (by municipalities)
Table 1
Typology of municipalities of the Republic of Crimea according to the degree of intensity and direction of transformation of the age structure of the population
| Age structure type | Aging index value | Age structure dynamics | Municipal units |
|---|---|---|---|
| Very young | I old. (Х) < I old. (40.0) | — | — |
| Young | I old. (40.1) ≤ I old. (Х) < I old. (70.0) | — | — |
| On the eve of old age | I old. (70.1) ≤ I old. (Х) < I old. (100.0) | — | — |
| Moderately old | I old. (100.1) ≤ I old. (Х) < I old. (130.0) | Slow rejuvenation trend | Krasnoperekopsky District; Dzhankoy District; Krasnogvardeisky District |
| Moderate rejuvenation trend | Belogorsky District | ||
| Slow ageing trend | Simferopol District; Sovetsky District | ||
| Moderate aging trend | — | ||
| Old | I old. (130.1) ≤ I old. (Х) < I old. (160.0) | Slow rejuvenation trend | Bakhchisarai District; Kirovsky District; Pervomaisky District; Simferopol City District; Nizhnegorsky District |
| Moderate rejuvenation trend | — | ||
| Slow ageing trend | Saksky District; Sudak Urban District; Black Sea Region | ||
| Moderate aging trend | — | ||
| Very old | I old. (160.1) ≤ I old. (Х) | Slow rejuvenation trend | — |
| Moderate rejuvenation trend | Kerch Urban District | ||
| Slow ageing trend | Razdolnensky District; Evpatoria Urban District; Krasnoperekopsk Urban District; Yalta Urban District; Alushta Urban District; Armyansk Urban District; Saki Urban District; Feodosia Urban District; Leninsky District | ||
| Moderate aging trend | Dzhankoy Urban District |
The study revealed 9 municipalities of the republic with a tendency to rejuvenate the age structure (2 urban districts and 7 districts). It should be noted that only three of them have recorded positive quantitative dynamics of the population over the past five years (Kerch, Belogorsky and Kirovsky districts). In all three cases, it was provided by migration inflow of population [13] (Table 2).
Table 2
Migration balance of the population of municipalities of the Republic of Crimea, 2017–2021 (‰)
| Municipalities | Migration balance of the population of municipalities of the Republic of Crimea (‰) | ||||
|---|---|---|---|---|---|
| 2017 | 2018 | 2019 | 2020 | 2021 | |
| Alushta Urban District | 14.9 | 11.3 | 14.50 | 13.6 | 12.2 |
| Armyansk Urban District | –4.1 | –5.1 | –0.30 | 2.4 | 10.4 |
| Dzhankoy Urban District | 6.2 | –1.3 | –2.40 | 4.2 | –4.3 |
| Evpatoria Urban District | 9.0 | 11.3 | 7.80 | 11.4 | 9.6 |
| Kerch Urban District | 13.0 | 9.8 | 11.40 | 13.9 | 4.6 |
| Krasnoperekopsk Urban District | –6.4 | –5.4 | –2.40 | 4.5 | 5.2 |
| Saki Urban District | 2.8 | 4.4 | 6.10 | 5.1 | 10.8 |
| Simferopol City District | 3.9 | –0.2 | 1.38 | –4.8 | 2.7 |
| Sudak Urban District | 4.8 | 2.2 | –4.80 | –1.1 | –3.0 |
| Feodosia Urban District | 7.5 | 7.9 | 6.90 | 10.3 | 17.9 |
| Yalta Urban District | 7.2 | 6.2 | 3.70 | 7.6 | 7.8 |
| Bakhchisarai District | –7.8 | –6.8 | 6.80 | 6.2 | 1.3 |
| Belogorsky District | 1.1 | 0.0 | 3.80 | 0.5 | 5.5 |
| Dzhankoy District | –7.9 | –6.7 | –2.60 | 0.9 | –2.9 |
| Kirovsky District | 6.7 | 6.2 | 4.40 | 1.5 | 3.8 |
| Krasnogvardeisky District | 0.6 | –2.4 | 0.00 | 4.6 | 4.1 |
| Krasnoperekopsky District | –8.5 | –3.1 | –4.20 | 0.4 | –0.8 |
| Leninsky District | –6.0 | –4.1 | –1.70 | -2.4 | –8.6 |
| Nizhnegorsky District | –7.0 | –3.4 | 3.60 | 5.8 | 3.0 |
| Pervomaisky District | –10.2 | –12.5 | –6.10 | 2.4 | –1.5 |
| Razdolnensky District | –0.9 | –2.6 | –2.50 | 8.4 | 9.3 |
| Saksky District | 6.3 | 4.7 | 11.30 | 9.2 | 12.8 |
| Simferopol District | 15.0 | 8.0 | 8.50 | 14.8 | 19.8 |
| Sovetsky District | –3.4 | -2.8 | –2.90 | –2.9 | –0.3 |
| Black Sea Region | 8.5 | 5.9 | 8.10 | 15.7 | 22.2 |
The distribution of municipalities with a rejuvenation trend across the peninsula does not reveal a clear zoning in this process (Fig. 2). Any resettlement specifics are also not recorded in this process.
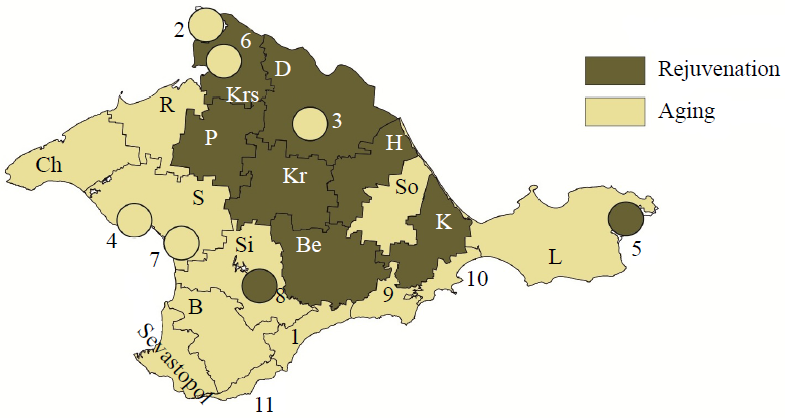
Fig. 2. Dynamics of the Crimean population aging process by municipalities, 2014‒2021
It should be noted that the analysis of the dynamics of population aging of such a multi-ethnic society as Crimea should take into account the specifics of the ethnodemographic structure of each municipality and shifts in the ratio of leading national groups. For the republic, the analysis of the dynamics of three most numerous peoples, Russians, Crimean Tatars and Ukrainians, who have serious specifics of their age structure and tangible sociodemographic features, is of decisive importance (Fig. 3).
The age structure of the Crimean Tatars is distinguished by a uniform distribution of the population across 10-year cohorts, recorded both in 2014 and in 2021, with enough young average age of 33.2 years. The structure of the Ukrainian population of the peninsula is the oldest. In the mid-2010s its median age has already exceeded 50 years. The proportion of elderly people (60 +) was approaching a third. The age pyramid of the Russian people occupied an intermediate position, in its form somewhat more gravitating to the pyramid of the Ukrainian community — a reduced proportion of younger generations and a specific dominant of older ages (people 60 + made up almost 22%).
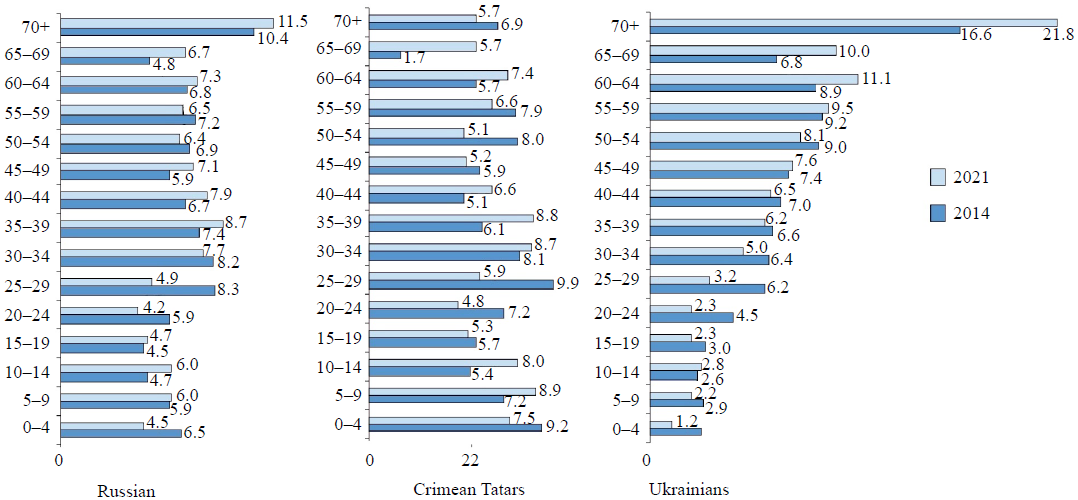
Fig. 3. Age structure of the three leading national communities of the Republic of Crimea, 2014‒2021 (%)
In the period between the last two censuses, the Ukrainian population of Crimea showed the maximum rate of aging. The share of elderly people in its composition increased from 32.3 to 42.9%, with a parallel compression of children and youth generations (0‒19 years old) from 11.4 to 8.8%, youth (20‒29 years old) from 10.7 to 5.5%.
The median age of representatives of the Ukrainian community of the peninsula for 2014–2021 increased by 6 years (from 50.3 to 56.3), which significantly exceeded the rate of aging of the other two leading national groups of Crimea, among the Russian and Crimean Tatars this indicator added 2.8 and 2.3 years, respectively (Fig. 4).
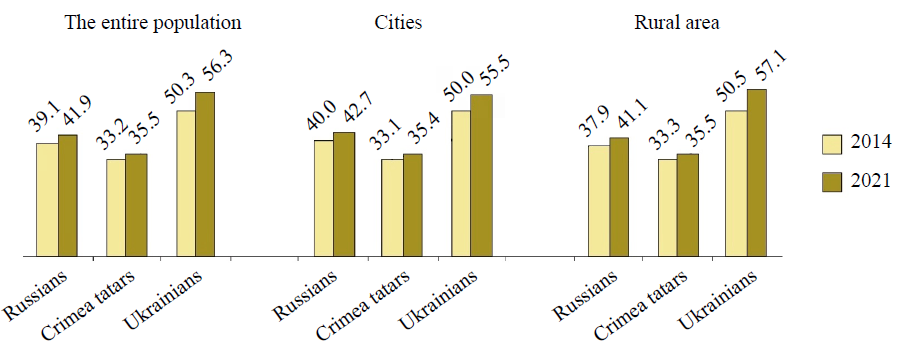
Fig. 4. Dynamics of median age of leading national communities in the Republic of Crimea, 2014‒2021 (number of years)
Analyzing the changes in the ethnic structure of the population in municipalities with a tendency to rejuvenate the age structure, we can conclude that this trend was largely due to a large-scale decline in local Ukrainian communities (as the oldest national group). In all territorial communities that showed a rejuvenation trend, the number of Ukrainians over the analyzed 7-year period decreased by 40‒57%. The rapid decline of the majority of the territorial Ukrainian communities of the peninsula in 2014–2021 could be explained by various factors: the outflow to Ukraine (the most intense in 2014); increased mortality associated with a high proportion of the old and elderly population; a change in the identity of some Ukrainians and representatives of the mixed Russian-Ukrainian population in the new socio-political conditions. Only the first two factors worked to rejuvenate the age structure of the population. An additional condition, as a rule, was a noticeable quantitative growth of the Russian population and, especially, the Crimean Tatars (Table 3).
Table 3
Increase/decrease in the number of the largest ethnic groups in municipalities with a tendency to rejuvenate the age structure (2014‒2021)
| Municipalities | Ethnic groups (increase/decrease in number, % of 2014 values) | ||
|---|---|---|---|
| Russians | Crimean Tatars | Ukrainians | |
| Kerch Urban District | 6.90 | –6.91 | –56.62 |
| Simferopol Urban District | 1.31 | ‒3.12 | –52.63 |
| Bakhchisarai District | 14.52 | 18.72 | –50.52 |
| Belogorsky District | 17.87 | 17.32 | –51.34 |
| Dzhankoy District | 20.95 | 0.16 | –46.48 |
| Kirovsky District | 7.21 | 9.17 | –51.99 |
| Krasnogvardeisky District | 15.93 | 7.98 | –51.48 |
| Krasnoperekopsky District | 38.35 | 19.53 | –39.72 |
| Nizhnegorsky District | 5.52 | 5.93 | –44.17 |
| Pervomaisky District | 25.59 | 14.33 | –48.02 |
| Sudak Urban District | 21.00 | 0.24 | –45.40 |
In municipalities with the aging trend of the age structure, the dynamics of the national composition was multidirectional, not allowing to record any clear correlation between these two processes, which was also generally natural, since the pace and vector of transformation of the population age structure of the territorial communities in Crimea represented the resulting group of factors, the overall composition of which was noticeably different for each of these administrative formations. This statement, however, does not negate the conclusion that the ethnodemographic factor plays a significant role in the dynamics of the population age structure of municipalities (Table 4).
Table 4
Increase/decrease in the number of the largest ethnic groups in municipalities with an aging trend in the age structure (2014‒2021)
| Municipalities | Ethnic groups (increase/decrease in number, % of 2014 values) | ||
|---|---|---|---|
| Russians | Crimean Tatars | Ukrainians | |
| Alushta Urban District | 26.25 | –8.53 | –52.60 |
| Armyansk Urban District | 1.60 | –6.25 | –42.13 |
| Dzhankoy Urban District | 5.54 | –22.05 | –54.34 |
| Evpatoria Urban District | 7.85 | 7.02 | –53.99 |
| Krasnoperekopsk Urban District | 21.59 | 44.89 | –41.88 |
| Saki Urban District | 3.16 | 4.38 | –36.57 |
| Feodosia Urban District | –5.18 | 5.41 | –55.50 |
| Yalta Urban District | 2.01 | –24.38 | –63.56 |
| Leninsky District | 12.75 | 21.56 | –55.48 |
| Saksky District | 15.93 | –2.58 | –41.77 |
| Simferopol District | 21.07 | 21.65 | –43.63 |
| Sovetsky District | 9.00 | 5.07 | –45.87 |
| Black Sea Region | 13.22 | 1.35 | –51.38 |
Discussion and Сonclusion. According to the results of the study, all municipalities of Crimea without exception are characterized by the old age structure of their population, ranging from moderately old to very old (24% — moderately old structure; 32% — old age structure; 44% — very old age structure). Among them there is a tendency to rejuvenate the age structure (2 urban districts and 7 districts) in 9 municipalities of the republic.
In the ethnodemographic composition of the population of municipalities, the most significant for their age structure was the ratio of three leading nationalities: Russians, Ukrainians and Crimean Tatars (first of all, we are talking about Ukrainians and Crimean Tatars). An increased proportion of Ukrainians determined the belonging of the territorial community to the group of old types of the population age structure, Crimean Tatars to one of the young types (from among those present on the peninsula).
1. Sushchiy S.Ya. Geodemographic dynamics of Crimean population: main trends and factors of the post-Soviet period. Regional economy. The South of Russia. 2021;9(4):121‒134. (In Russ.). https://doi.org/10.15688/re.volsu.2021.4.12
2. Volkhin D.A., Shvets A.B., Kuzmenko N.I. Rural territories of the Crimean Mountains: socio-demographic characteristics. Geopolitics and ecogeodynamics of regions. 2023;9(3):80–94. (In Russ.)
3. Voronin I.N., Sikach K.Yu., Sazonova G.V., Shvets A.B. Mapping of transformation processes in the ethnodemographic space of the Crimea. InterKarto. InterGIS. 2021;27(4):273‒291. (In Russ.) https://doi.org/10.35595/2414-9179-2021-4-27-273-291
4. Manakov A.G., Vampilova L.B. Assessment of the degree of heterogeneity of the ethnic structure of the Crimean population from 1897 to 2014. Pskov Regionological Journal. 2023;19(1):113–128. (In Russ.). https://doi.org/10.37490/S221979310023933-9
5. Ozhegova L.A., Sazonova G.V., Sikach K.Yu., Zueva I.B. Dynamics and territorial features of socio-demographic processes in the Russian Crimea. Scientific notes of the V.I. Vernadsky Crimean Federal University. Geography. Geology. 2020;6(3):135–151. (In Russ.)
6. Ostrovskaya I.V. Historical retrospective of socio-demographic processes in Crimea and Sevastopol in 1991 – early 2014. Society and personality: humanization in the context of information and communication culture. Collection of scientific articles by teachers, university students, researchers and practitioners. Stavropol; 2018. Pp. 513‒520. (In Russ.)
7. Svishcheva N.V. Demographic analysis of processes of natural population movement in Republic of Crimea for 2015‒2018. Problems and achievements through the eyes of the young: theoretical and practical aspects. Collection of scientific articles by students based on the materials of the student week and student participation in round tables in the scope of the VI International Forum of the Financial University. Moscow; 2020. Pp. 144‒153. (In Russ.)
8. Department of the Federal State Statistics Service for the Republic of Crimea and Sevastopol. Statistics. Censuses and surveys. Population census in the Crimean Federal District with 100% coverage of the 2014 population of the Republic of Crimea. Results. Age and gender composition and marital status. Population by gender and age. (In Russ.) URL: https://82.rosstat.gov.ru/storage/mediabank/pub-02-01(1)_638164.pdf (accessed: 12.04.2025).
9. Department of the Federal State Statistics Service for the Republic of Crimea and Sevastopol. Statistics. Censuses and surveys. All-Russian Population Census 2020, Republic of Crimea. Results. Age and gender composition and marital status. Population by age group and gender by regions of the Republic of Crimea. (In Russ.) URL: https://82.rosstat.gov.ru/folder/179764 (accessed: 12.04.2025).
10. Dlugosz Z. The level and dynamics of population ageing process on the example of demographic situation in Europe. Bulletin of Geography (Socio-Economic series). 2003;2:5–15.
11. Sekitski-Pavlenko O.O. The typology of the transformation of the age structure of the population of regions of Russia. Economy of the region. 2023;19(3):813‒827. (In Russ.). https://doi.org/10.17059/ekon.reg.2023-3-15
12. Antipova E.A. Typological approaches in the study of demographic aging of the rural population of Belarus. Regional studies. 2007;3:3–12. (In Russ.)
13. Monitoring of socio-economic development of municipalities of the Republic of Crimea. (In Russ.) URL: https://minek.rk.gov.ru/structure/61f77822-f439-4bf9-b242-42c6d18bece6 (accessed: 12.04.2025).
Uznarodov Dmitry Igorevich, Cand. Sci. (Political Sciences), Senior Researcher, Laboratory of Sociology, Federal Research Center Southern Scientific Center of the Russian Academy of Sciences (41, Chekhov Avenue, Rostov-on-Don, 344006, Russian Federation)
Uznarodov D.I. Territorial and Settlement Characteristics of the Dynamics of Population Ageing in the Republic of Crimea (2014‒2021). Science Almanac of Black Sea Region Countries. 2025;11(3):14-23. https://doi.org/10.23947/2414-1143-2025-11-3-14-23
344000, Rostov-on-Don, Gagarin sqr, 1, building 8, office 411.
Tel/fax: +7 (863) 273-86-63
e-mail: science-almanac@mail.ru